Central Profiles of Dark Matter Halos
Daisuke Iono, Ian Mulvany, Ewan Todd
Adviser: Tom Quinn
Simulations of standard Cold Dark Matter cosmologies fail to reproduce
the relatively flat central density profiles of low surface brightness
galaxies. We are exploring whether this problem can be remedied by adding
new physics into the central regions of the dark matter halo in a heuristic
manner. Examples of the physics we will try to mimic include clearing out
of the baryons by supernovae and stirring of the central dark matter by
black holes or molecular clouds.
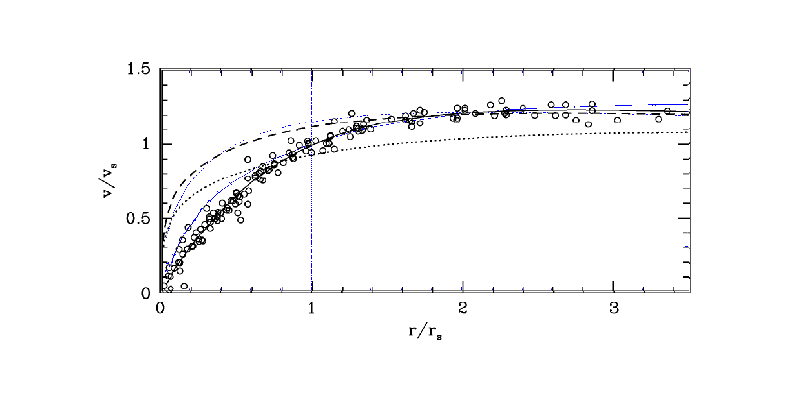
Consider the following diagram, which is taken from figure 2 of Moore
et al. 1999 (astro/ph
9903164). The circles show data points from a number of low surface
brightness galaxies (LSBs) and dwarfs. These galaxies are distinguished
by having an extremely low fraction of baryons compared to dark matter.
These galaxies have proved to be the bane of numerical cosmology because
dark matter haloes in cosmological n-body simulations are unable
to reproduce the rotation curves of these galaxies. The diagram shows
typical rotation curves obtained from the sinulations' haloes as the dashed
and dotted black lines. Although most galaxies fit this kind of profile,
the LSBs clearly exhibit a rotation curve that is depressed in the inner
region. We took a galaxy halo from a Parallel KD tree n-body code
(which, at the start of our simulation had a typical rotation profile,
shown here by the dotted blue line), and, by making a rather drastic evacuation
of mass from the center of the galaxy and then evolving it forward in time
until it had settled down to a steady state, we were able to obtain the
rotation curve shown by the solid blue line. This shows that, by
including physical effects that quickly alter the mass distribution
in the galaxy, it is possible to obtain significantly better rotation curves
than those that n-body codes have been able to achieve to date.
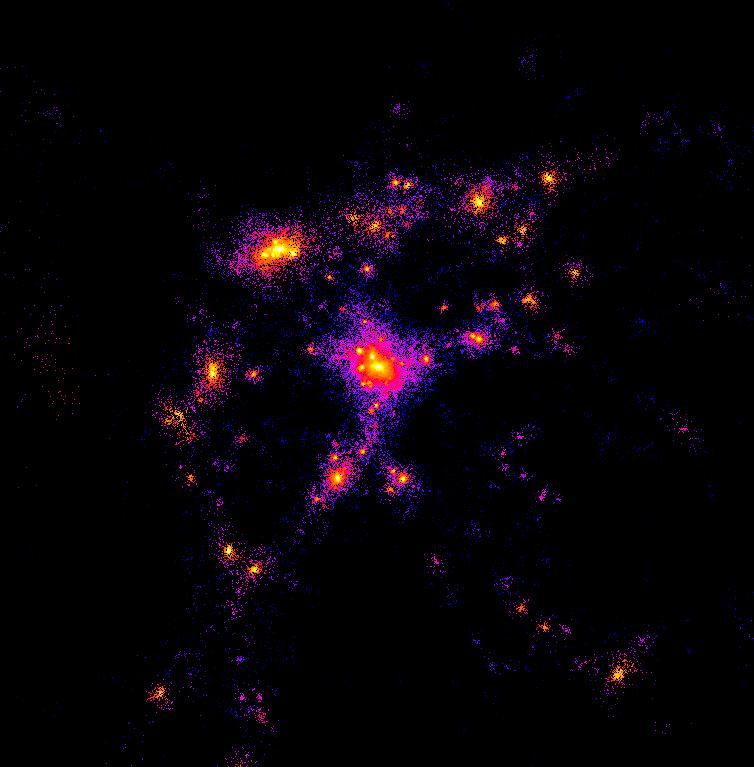
The following is a frame from our entire simulation region. The large bulge in the center of this
frame is the cluster of interest. The box size is one megaparsec and our cluster extends to
a distance of approximately 200 kiloparsecs from its centre.
Here is a close up of the core cluster out to a radius of 200 kiloparsecs. Mass was systematically removed
from the central 100, and then later 200, parsecs. We modelled the blowing out of the baryonic matter through some process by removing 5% of the total mass of the cluster out to these radii.
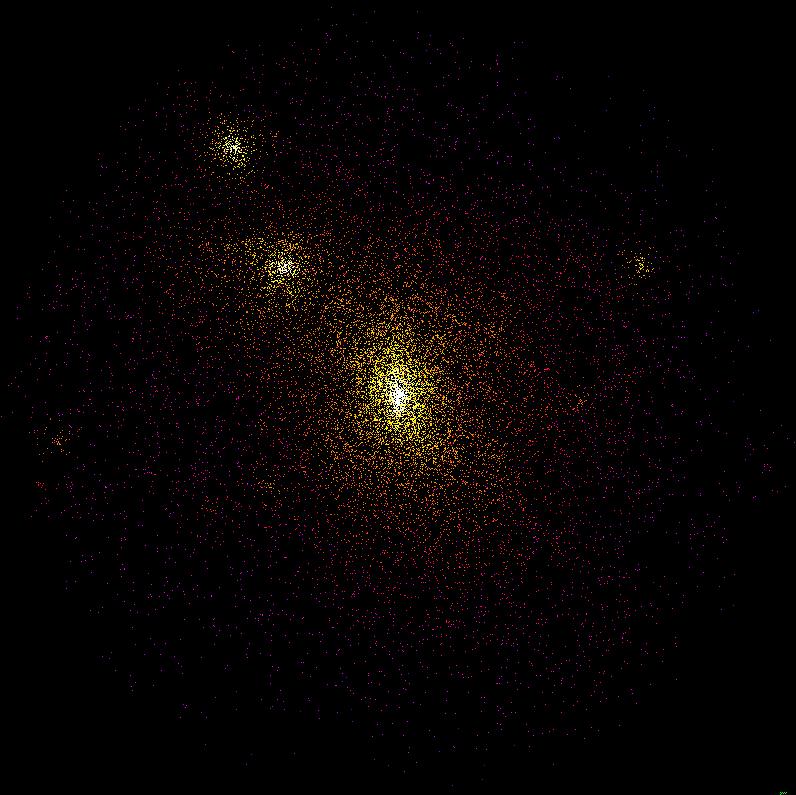

The colours in the images represents density. This bar indicates the variation
in density from 0 to 1e5 in units in which 1 represents the critical density of
matter dominated Universe. The simulation was performed using comoving coordinates.
|us| |slides|
|home| |links| |art|
|mail me|
Back to Computing Our Universe 1999