|
||||||
| Home | About SCP | News and Press | People | Publications | Internal | |
|
What We Can "See" in a Supernova |
|
|
The Supernova Cosmology Project
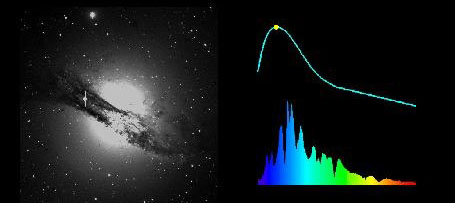
The image above and the movie clips ( QuickTime, or MPEG), show three simulated representations of a supernova -- an exploding star -- that recently occurred in the Centaurus A galaxy. The image on the left shows how a supernova appears as it brightens and fades -- becoming comparably bright to the entire galaxy of stars in which it explodes. The upper right graph shows this brightness as a function of time, and the moving dot indicates where on this curve the supernova's brightness is, from the image at left. The bottom right graph shows how the spectrum of the supernova changes during this same period. The height of this graph for each color shows how bright the supernova is in that color. This clip was prepared by the Supernova Cosmology Project (P. Nugent: spectral sequence; A. Conley: image sequence) with the help of Lawrence Berkeley National Laboratory's Computer Visualization Laboratory (N. Johnston: animation) at the National Energy Research Scientific Computing Center. |
|